How to Shift Inventory Based on Shifts in Consumer Demand
The COVID-19 pandemic continues to cause shifts in consumer demand. Some consumers are shopping at fewer retail stores but buying more on each trip. Others are flocking to eCommerce and other low-contact shopping methods, like curbside pickup.
At the same time, retail suppliers must adapt to changing consumer shopping patterns. Here are three questions many of our customers are asking:
1. Which of my retailers are reopening? How can I support sales with those retailers?
As retail stores reopen, it’s crucial to have enough inventory at the right locations.
For example, we worked with a toy supplier that sells to a mix of eCommerce and brick-and-mortar retailers. Some of its retail customers were starting to open after being closed due to COVID-related shutdowns. This supplier used location-based data to make recommendations to their retail customers. Their retailers could then adjust allocations based on current sales and inventory trends.
By using SPS Analytics, this customer:
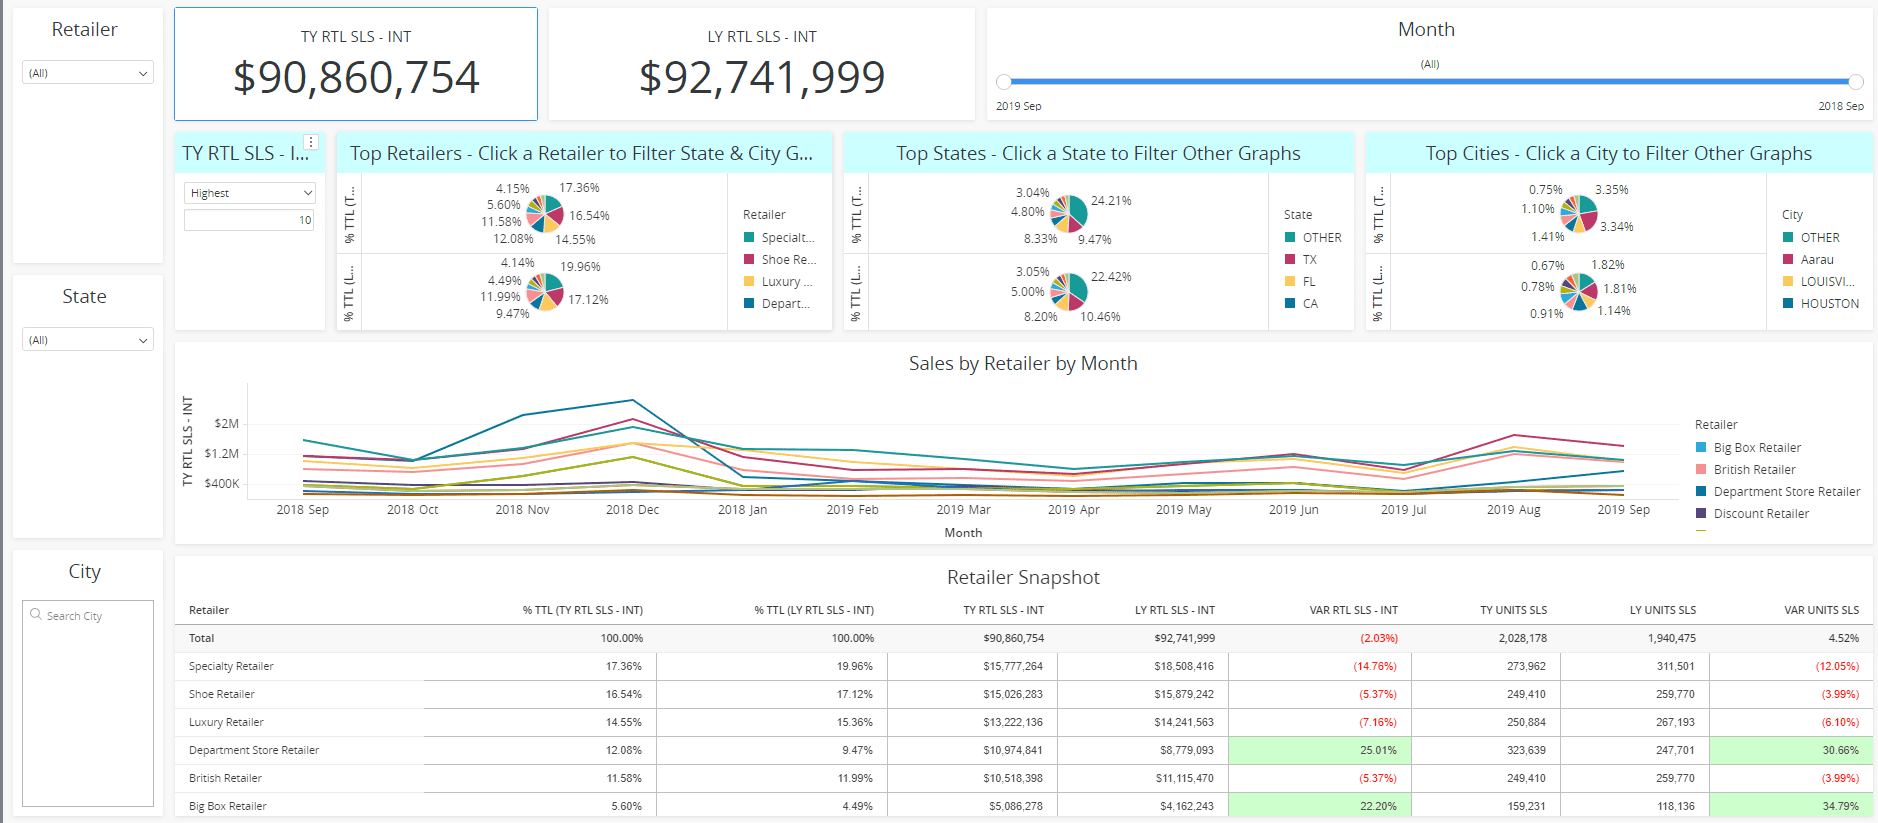
- Leveraged dashboards to understand which retailers increased sales when stores reopened.
- Analyzed store performance in the months before and after store closures.
- Partnered with stores showing an uptick. This ensured they had the right inventory based on the current sales trend.
2. Which of my retailers are closing stores? Where are those sales shifting to based on shifts in consumer demand?
During state lockdowns, many stores temporarily shut down. Others have permanently closed. When this occurs, consumers shift their business to a store offering the same or similar products.
For example, we worked closely with a licensed sportswear supplier that was concerned about a retailer that was closing locations. The supplier wanted to get ahead of these closings to offset the market share changes from the closing locations.
With SPS Analytics, this customer:
- Used dashboards to analyze sales and sell-through during store closures.
- Identified retailers whose percentage of sales increased.
- Used visualizations to identify city and state opportunities within their POS data.
- Proactively partnered with retailers to avoid losing market share.
3. What are my top performing cities and states? How can I shift the focus on my sales and marketing to those areas?
Geographic trends have also had a profound effect on sales performance, now more than ever.
We worked with an apparel supplier to use POS data to identify shifts in sales at the retailer and city level. By filtering out retailers that weren’t open, the supplier could quickly analyze sales at multiple retailers for two different time periods.
SPS Analytics helped this customer:
- Use dashboards to understand which cities have the highest percentage of sales.
- Identify specific retailers with sales that are increasing in this city.
- Proactively develop strategies based on where retailers’ sales are shifting to.
SPS Analytics can help you capitalize on sales opportunities, even during times of disruption. Using these strategies, you can effectively respond to retailers re-opening, going out of business, or shifting inventory. With the right data, you can keep your product in stock and maximize sales.
Get one step ahead of shifts in consumer demand with our SPS Analytics Solution. Learn more about our solution and sign up for a quick demo.
Are you an SPS Analytics user already? Check out our Training Center video to learn how to optimize inventory.

- Capture buyer’s attention with retail sell-through data - August 16, 2022
- Understanding Sell-Through Rate - July 27, 2022
- Product Forecasting for 2021 and Beyond - November 25, 2020

RELATED POSTS
Key considerations for an SAP cloud m...
4 strategies to conquer lean inventor...
5 common problems distributors face