Seasonal POS Reporting Doesn’t Have To Be A Challenge.
SPS Commerce Analytics uses your retailers’ POS data to help you meet your seasonal sales goals. The analyses shift your focus to the stores, regions or retailers that need your attention, and to products with sales above or below expectations.
Level Up Your Seasonal Forecasts With Validate Data
If your business is dependent on the change of seasons, the stress of seasonal demand forecasting is real. Maximizing sell-through and managing inventory are paramount. SPS Commerce Analytics uses your retailers’ POS data to help you meet your seasonal sales goals.
Suppliers Define Seasons Differently, But All Rely on Data
The definition of a supplier’s sales seasons varies. But suppliers all need data insights to optimize sales. Each season, demand planners and sales analysts ensure that the seasonal demand forecasting is set, and orders are placed. And they need access to current sales and inventory data to make decisions.
Here are the three types of seasons that impact inventory and product sales for most businesses:
Population Shifts
Retirees (a.k.a. snowbirds), tourists and migrant communities increase the size of many regions at specific times of the year. These population changes translate into increased demand. Using historical sales data, suppliers can plan for increased sales.
Dates
Are back-to-school, winter holidays or Valentine’s Day key sales drivers for your products? If so, it’s important to line up your inventories to match your sales during your target timeframes, leaving little inventory after the season. Use analytics to project sales accurately and maximize inventory and profits during the season.
Weather
Do snowflakes or warm weather trigger consumers to buy your products? Then your business needs to use historical sales and weather trends to determine when each season begins by state or region and you need to be ready to shift inventories if the snow, rain or sun comes early.
You need visibility into weekly sales and inventories regardless of how you define your seasons. When equipped with this data from SPS Commerce Analytics, you can manage by exception, react quickly and impact your business.
How to Forecast Seasonality
Most suppliers have a historical record of their orders by season. But, more importantly, they need access to POS data to understand how each store, online channel, retailer and product performed in previous seasons. These insights from SPS Analytics become the foundation for this season’s sales targets.
Let’s take a look at how seasonal demand forecasting plays out during a season:
Pre-Season: Align What Products Consumers Will Need with Orders
Before a season starts, planners are busy working on the next season. They ensure that needed products are on order and on the way. To accurately predict needed inventory, analysts use historical data and current trends from SPS Analytics to understand demand.
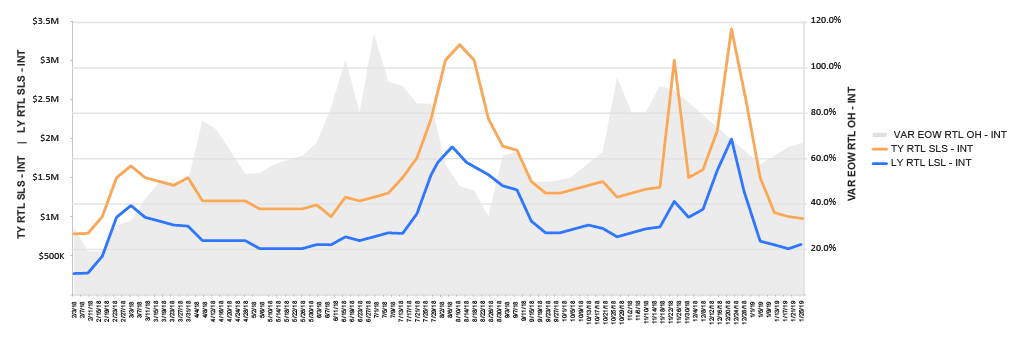
Suppliers can compare last year’s sales by week along with current trends to more accurately plan for demand by location, product or customer.
Visualizing seasonal demand forecasting data using SPS Analytics dashboards empowers suppliers to see:
- Sales levels of the same or similar products for the same season in prior years
- The timeframe when sales peaked and fell off during the season for each product or region
- Optimal inventory levels that will best support future sales
With these insights, suppliers can improve allocations and orders to match demand.
In-Season: Flexing to Meet Demand Changes
Planners know that they have only one shot to get the season right. There is no room for mistakes. They need to maximize sell-through and shift inventory to the right locations.
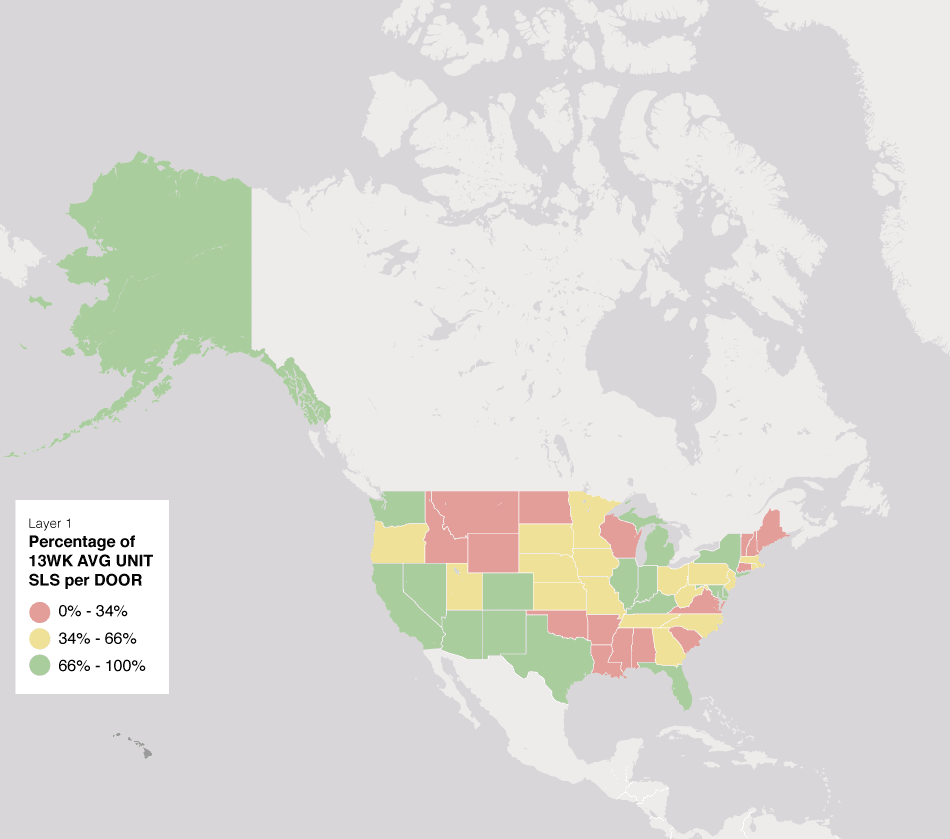
Quickly identify regions where in-season sales are strong and react to areas where attention is needed.
With weekly POS data from SPS Analytics, planners can quickly identify:
- How to flex inventory to support and maximize sales
- Where inventories are running low and stock outs are probable
- Which locations have excess inventory and could restock higher-performing stores or regions
- Where excess inventories exist and collaborate with retailers to begin markdowns earlier
Stay On Top Of Trends With Email Alerts
Alerts from SPS Analytics focus attention on at-risk sales. For example, an email can be sent whenever a product’s sell-through hits a pre-defined threshold. This is an opportunity to increase sales, but only if can be acted upon quickly.
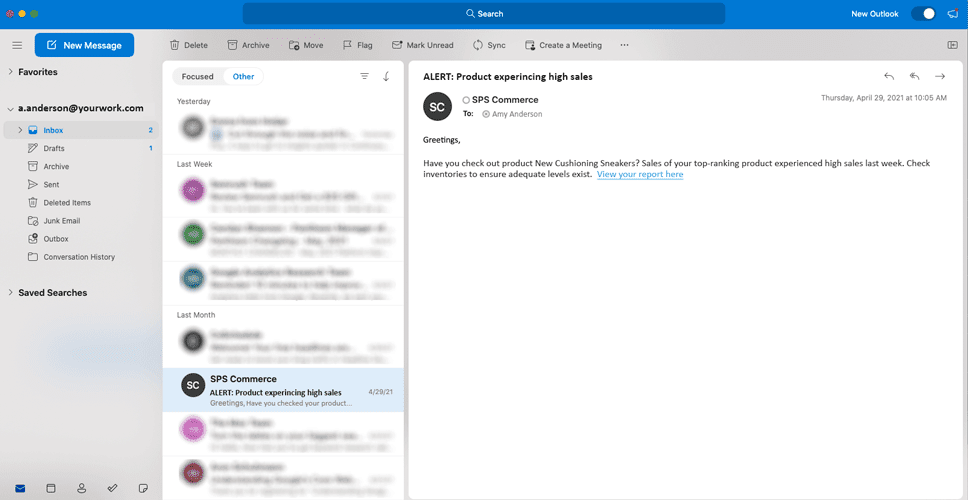
Planners can setup alerts that focus their attention on priority tasks based on sales variances.
Post-Season: Informing Markdown Strategies
Near the end of a season, suppliers pay close attention to where excess inventories exist. The retailer and supplier both want to maximize profitability. Using SPS Analytics, planners can make recommendations to retailers on how to shift inventory and when to start markdowns.
| Week | TY RTL SLS-INT | TY UNITS SLS | TY AUR-INT | VAR AUR-INT |
|---|---|---|---|---|
| Total | $23,348,156 | 477,125 | $48.68 | -3.0% |
| 08/11/2018 - 2018 | 27 | $3,189,937 | 64,286 | $49.62 | -2.5% |
| 08/04/2018 - 2018 | 26 | $3,000,307 | 59,513 | $50.41 | -1.2% |
| 07/28/2018 - 2018 | 25 | $2,238,308 | 44,919 | $49.83 | -0.3% |
| 07/21/2018 - 2018 | 24 | $1,850,036 | 37,379 | $49.49 | 0.2% |
| 07/14/2018 - 2018 | 23 | $1,521,312 | 30,513 | $49.86 | -1.1% |
| 07/07/2018 - 2018 | 22 | $1,408,623 | 29,531 | $47.70 | -2.5% |
| 06/30/2018 - 2018 | 21 | $1,231,964 | 25,623 | $48.08 | 1.6% |
| 06/23/2018 - 2018 | 20 | $1,221,025 | 25,642 | $47.62 | -4.2% |
| 06/16/2018 - 2018 | 19 | $1,333,229 | 29,098 | $45.82 | -11.8% |
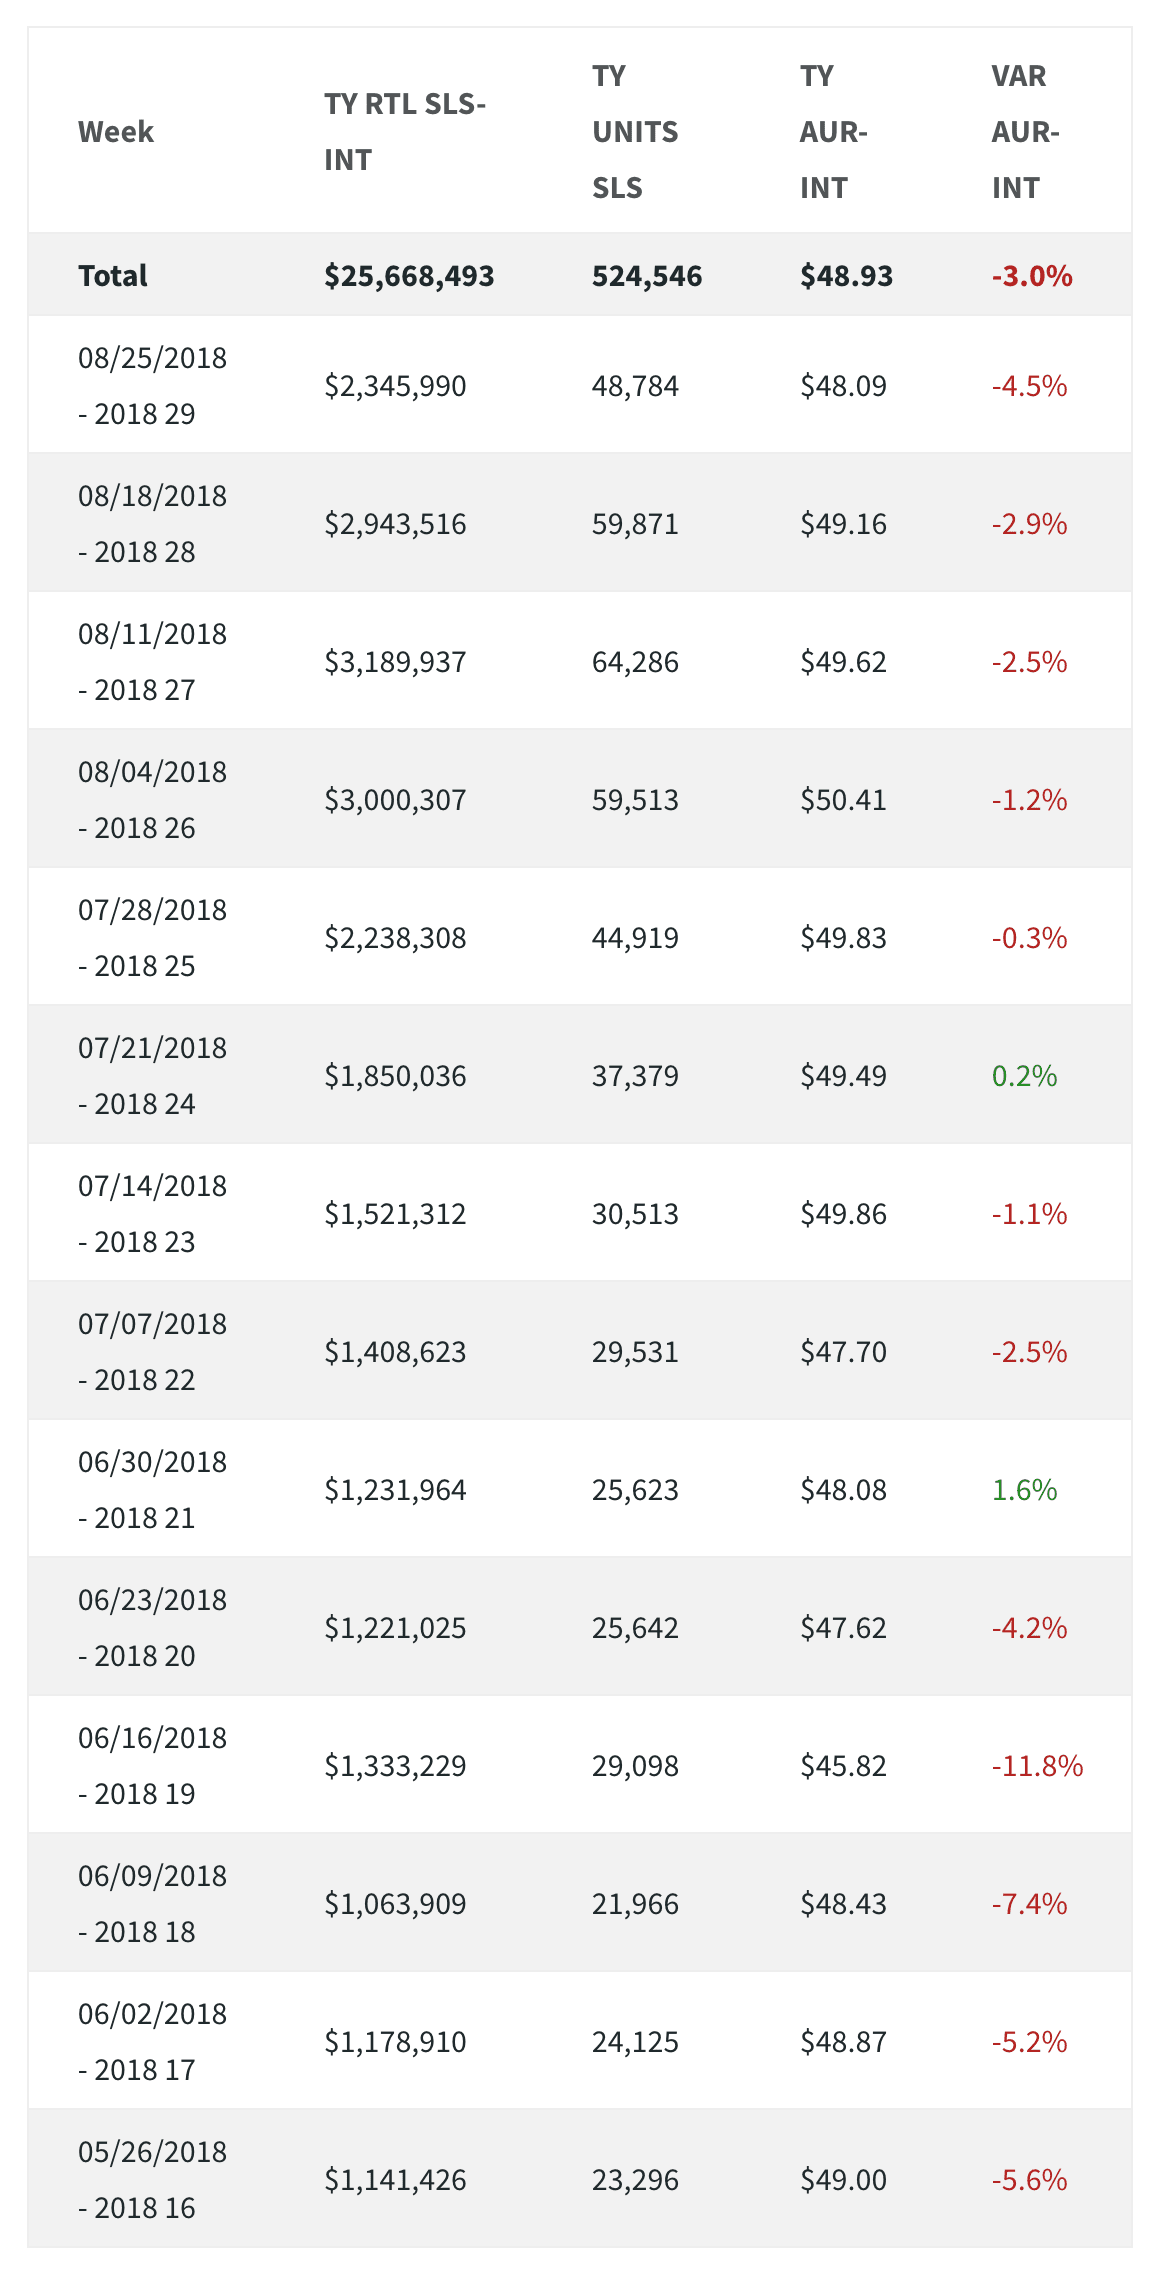
Use total retail sales data in SPS Analytics to track pricing changes and monitor markdowns.
Seasonal sales data provides insights on how to exit the season while retaining the highest margins possible by:
- Shifting excess inventory to high-performing locations
- Advising retailers on where and when to begin markdowns
- Monitoring the average unit retail price as it relates to the rate of sales
When suppliers have access to accurate, timely POS data, they can collaborate with their retailers to make seasonal adjustments. The earlier in the season the better.
Metrics that Matter for Seasonal Demand Forecasting
There are many reports and analyses that offer insights on seasonal sales. Within these are key measurements that can tell you a lot about your performance.
SALES: The monetary amount garnered in exchange for goods or services, calculated using the units sold and average unit retail.
Why it matters: Planners need to monitor seasonal sales performance across all locations and products, reacting quickly to trends and unpredicted shifts in demand.
INVENTORY: The number of items available for immediate sale, usually broken down by product, region or store.
Why it matters: Seasonal products have a limited shelf-life. Monitor inventory levels to ensure that you will have enough product to complete the season with minimal excess, thus maximizing profits and avoiding lost sales.
SELL-THROUGH: The ratio of the quantity of items sold versus the total quantity received by the retailer.
Why it matters: Suppliers need to track this metric to optimize in-season sales and react if the weekly sell-through rate is too high or low.
ON-ORDER: The quantity of items requested, but not yet received into inventory.
Why it matters: This data shows how many items will be available for sale in the near future and is used to inform pre-season planning decisions and allocations, typically based on prior years’ sales.
AVERAGE UNIT RETAIL: The average price of an item during a defined time period.
Why it matters: This metric monitors when retailers are doing markdowns on products. Use the data to determine why in-season sales didn’t occur as forecasted and how it impacted margins. With these insights, suppliers can improve this season and impact next season’s forecast.
Securing forecasting seasonal data:
tedious and delayed actions
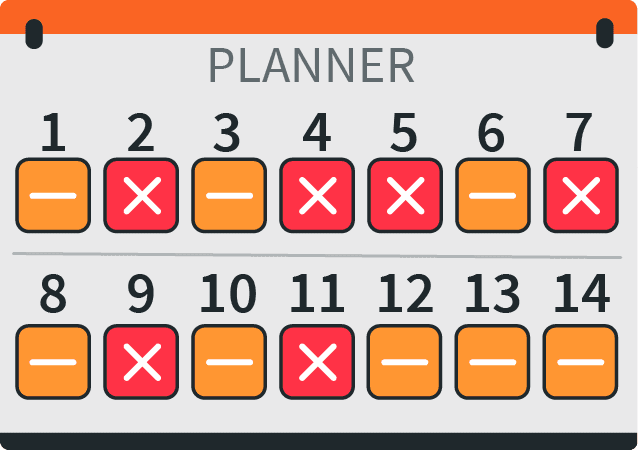
Day 1-2
Call, text or email your buyer to request your POS data or download it from a retailer portal.
Day 2-3
Take the retailers’ multiple data formats and combine them into a spreadsheet that shows your whole business, across all retailers.
Day 4-5
Wade through reports to uncover underperforming locations, excess inventory, and potential out-of-stock situations.
Day 4-5
Shift allocations and/or make recommendations to retailers to move inventory or change orders.
Day 11
Repeat this process to see sales from the past two weeks.
Securing forecasting seasonal data:
the SPS Analytics way
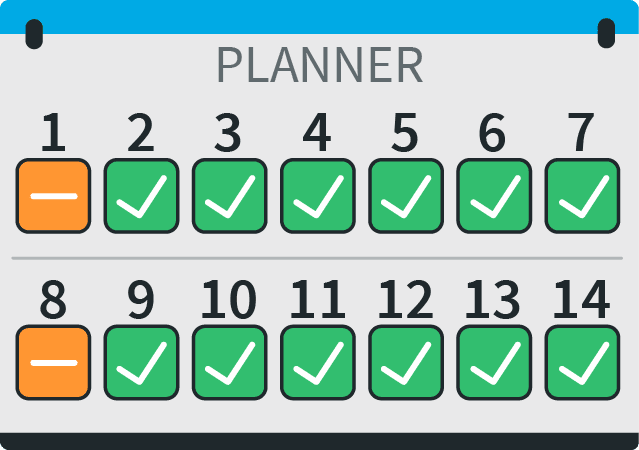
Day 1
Arrive at the office and see your POS data across all retailers is already available. It’s in one standardized format and ready to go.
Day 1
Arrive at the office and see your POS data across all retailers is already available. It’s in one standardized format and ready to go.
Day 1
Check your emails and find two alerts for locations low on inventory. Acting on this opportunity is now on today’s to-do list!
Day 7
Shift allocations and/or make recommendations to retailers to move inventory or change orders.
Seasons Change Fast, Make Decisions Now
Ready to manage your season by exception and without data delays? It’s time for SPS Analytics.
We collect the POS data from your retailers. Our experts clean and validate it. Then, we deliver it to your desktop or device each week.
It’s so much easier than doing it yourself, and your business can’t afford to wait.
SPS secures data from 2,500+ retailers, including eCommerce, and will advocate on a supplier’s behalf if their retailer is part of our community. It’s a win-win for them…and you.
Our Seasonal Data Specialist Can Answer Your Questions.
Fill out this form if you'd like to be contacted by a retail specialist to chat about your seasonal business and how SPS Analytics can help. And they can even give you a demo of SPS Analytics, if you wish.
