Improve your KPI performance
Identify trends, spot opportunities and optimize assortments with SPS Analytics. Our intuitive, tailored dashboards provide access to crucial KPIs, so you can drive higher sales and build stronger retail partnerships.
Uncover crucial insights
Retail KPIs are integral to the success of a brand. Elevate your performance with these impactful KPIs:
- Retail sales ($) – drive higher revenue by understanding sales performance and making season-to-season comparisons.
- Gross margin – boost profits by understanding margins on each item.
- Sell-through % – understand the percentage of inventory a retailer sells compared to the amount of inventory on hand.
- Sales lift % – determine whether your product sales are accelerating or declining.
- Avg discount % – evaluate how promotions or markdowns impact sales.
- Weeks of supply (WOS) – optimize stock levels with insight into remaining weeks of inventory.
See what you’re missing
SPS Analytics consolidates your sales and inventory data into a single platform. Enhance decision-making with dashboards that analyze performance across products, partners and channels.
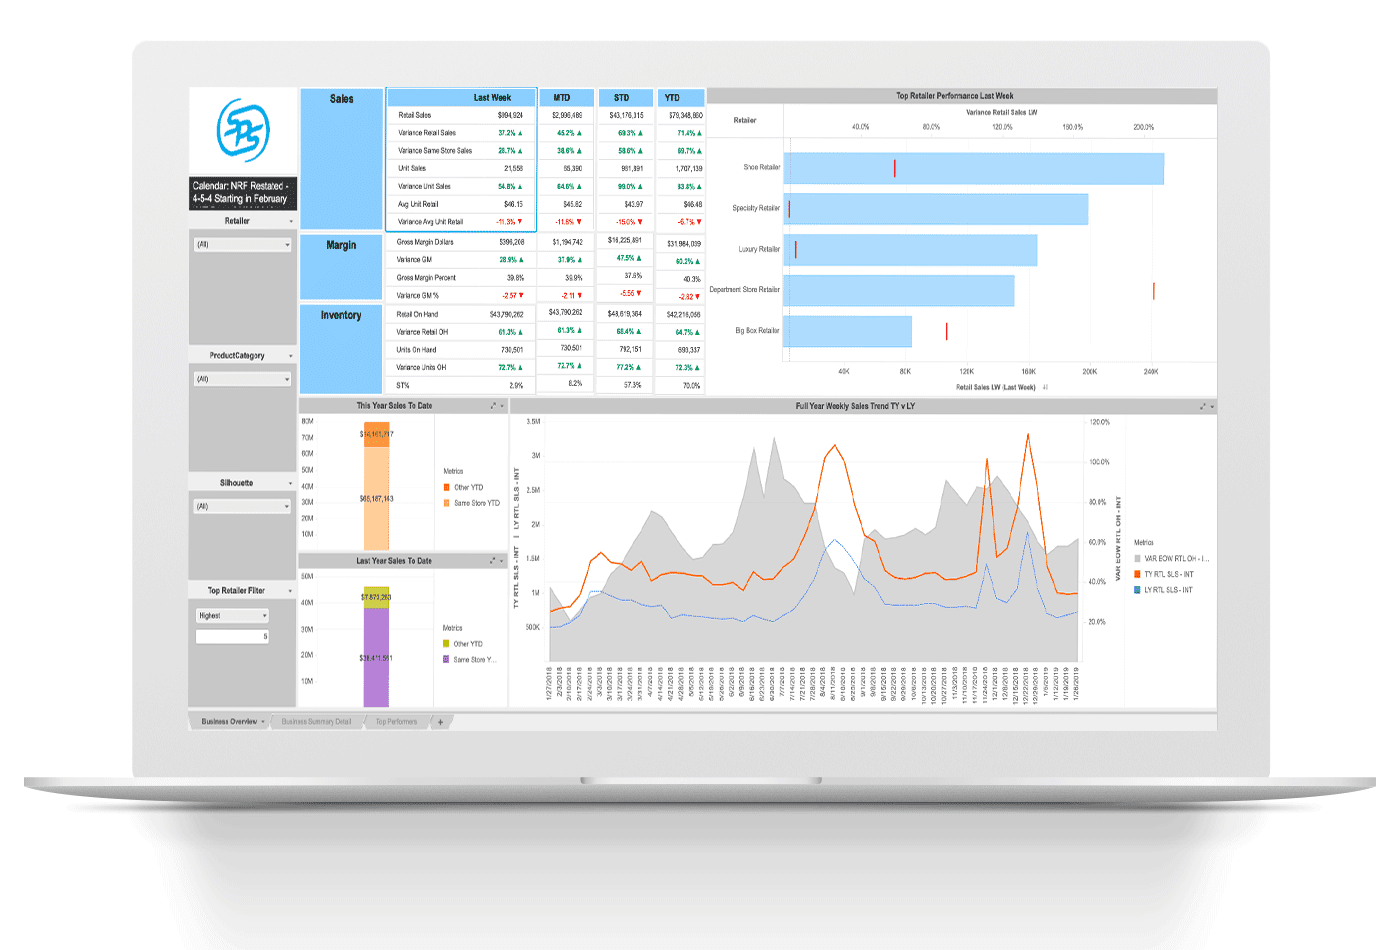
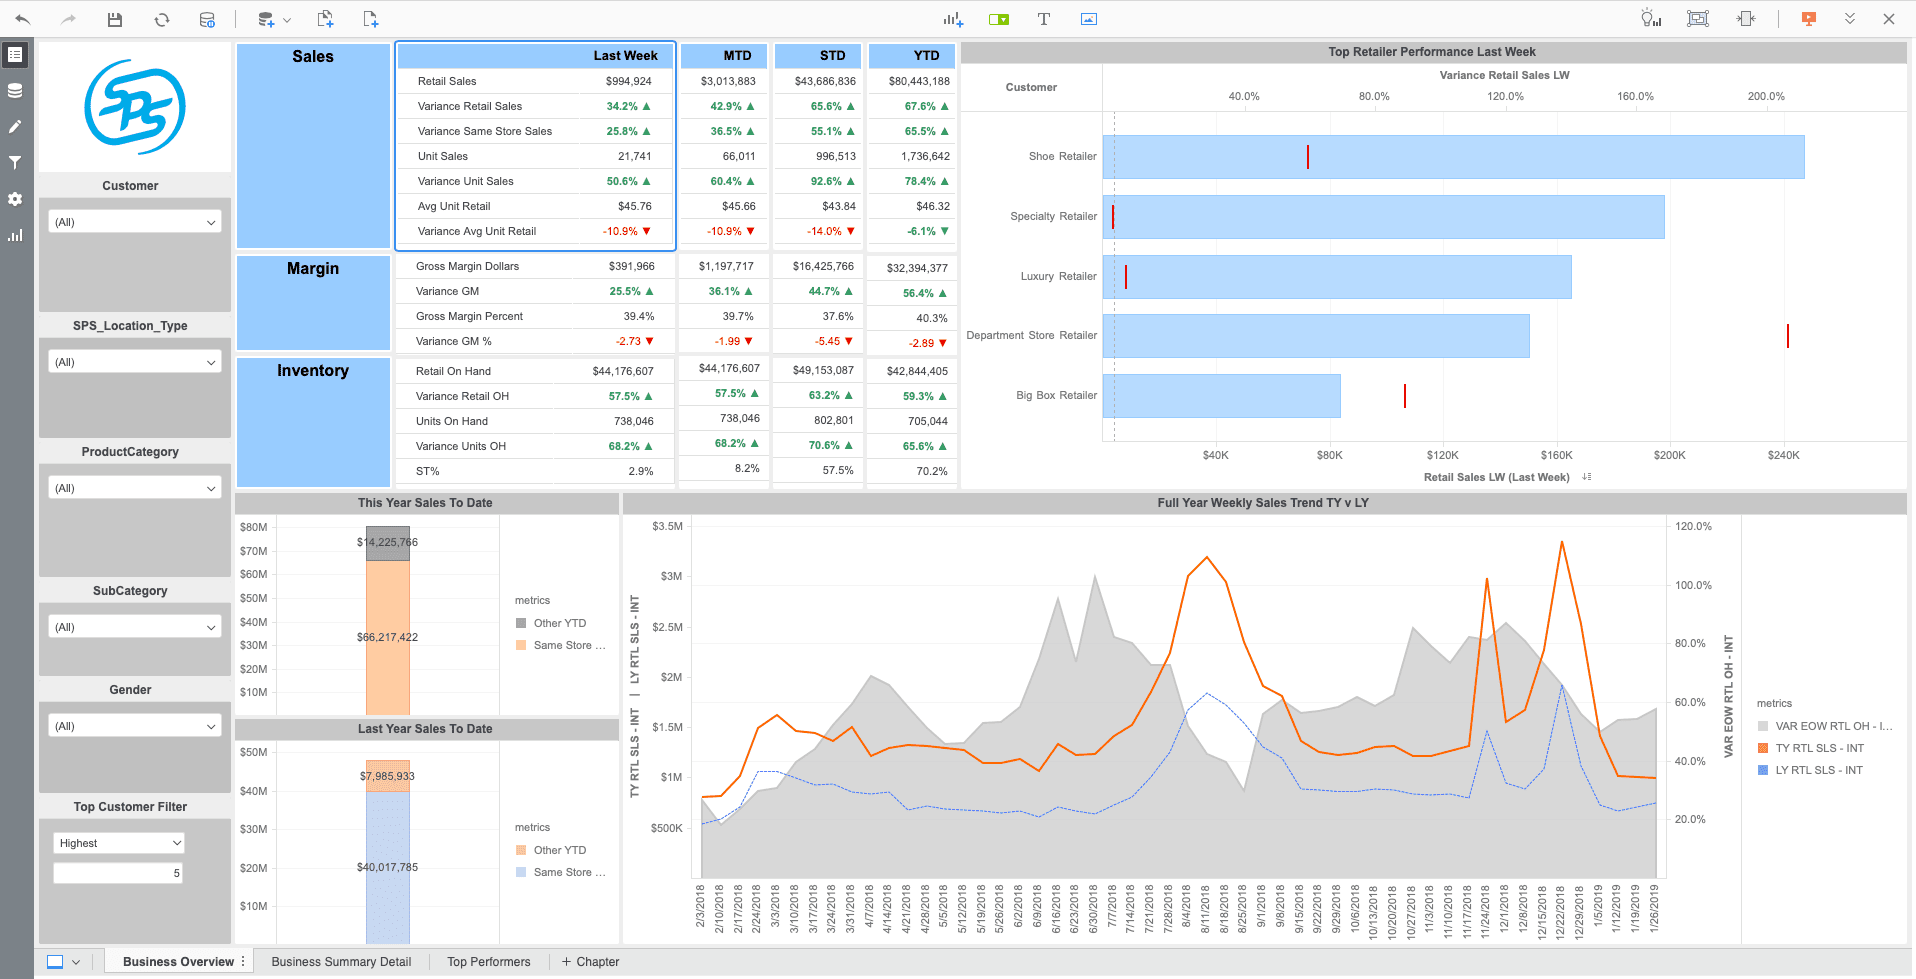
Business overview
See a high-level snapshot of sales performance across all your retailers and easily compare data. Get quick insights to identify top products and stores year over year (YoY).
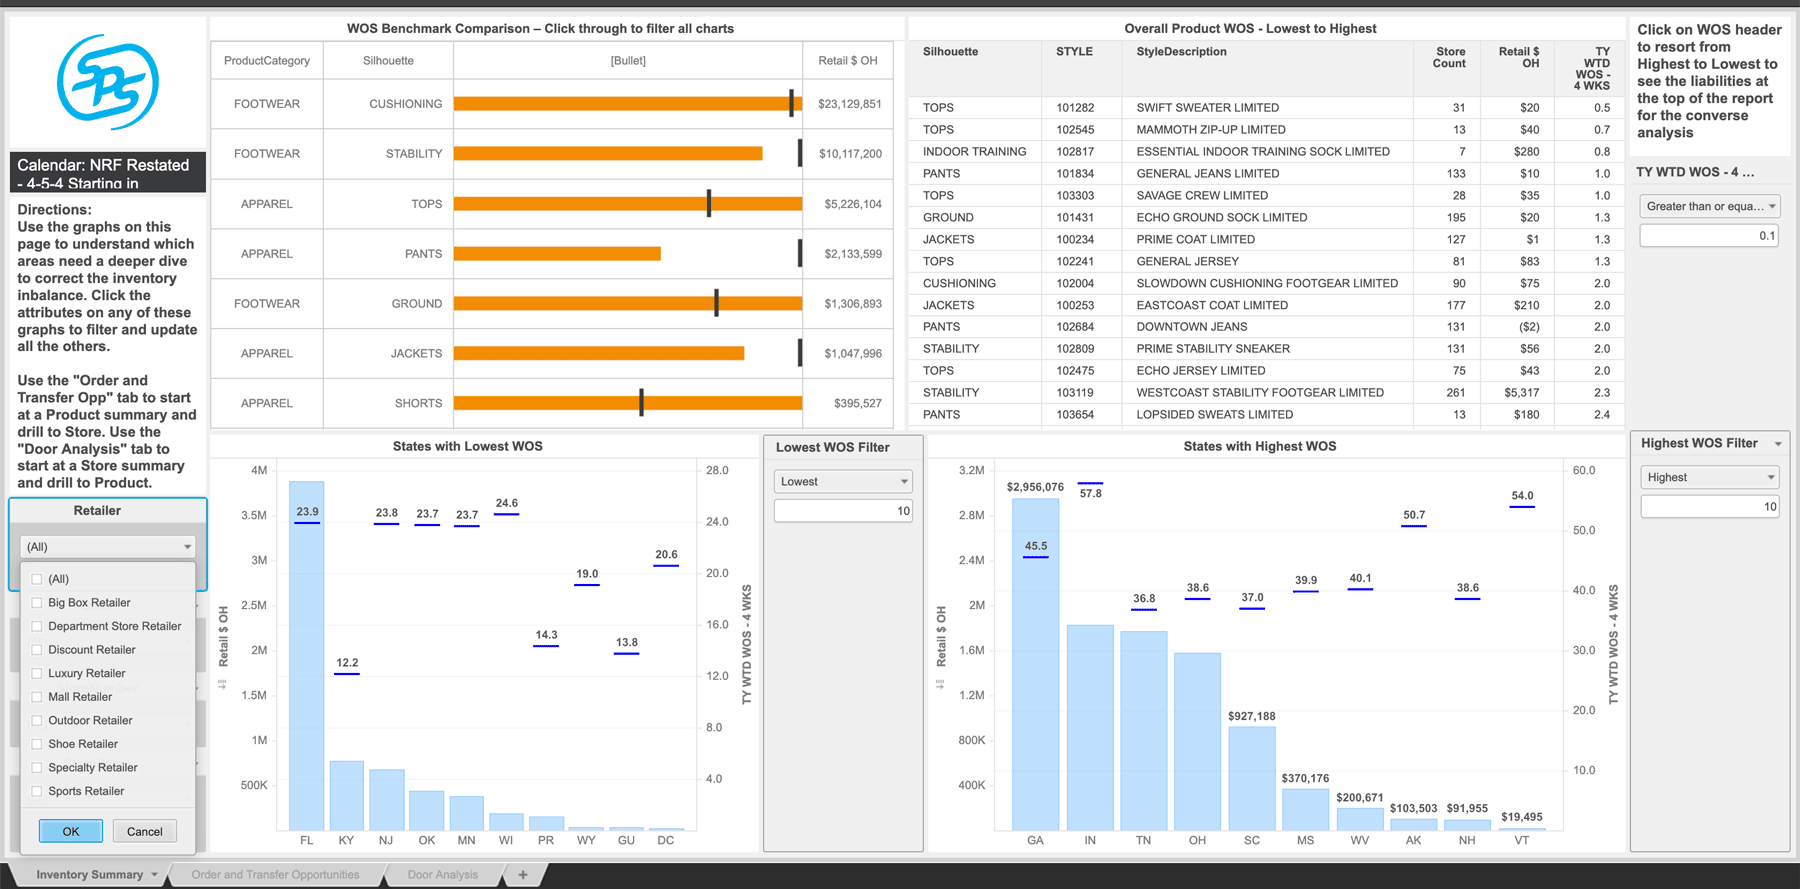
Inventory analysis
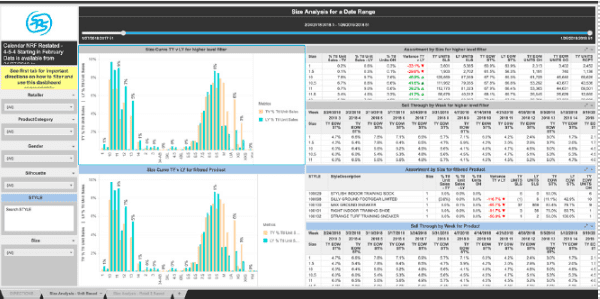
View inventory levels by product and store location. Understand where you may need to adjust your plan to minimize out of stock risks and alleviate potential overstocks.
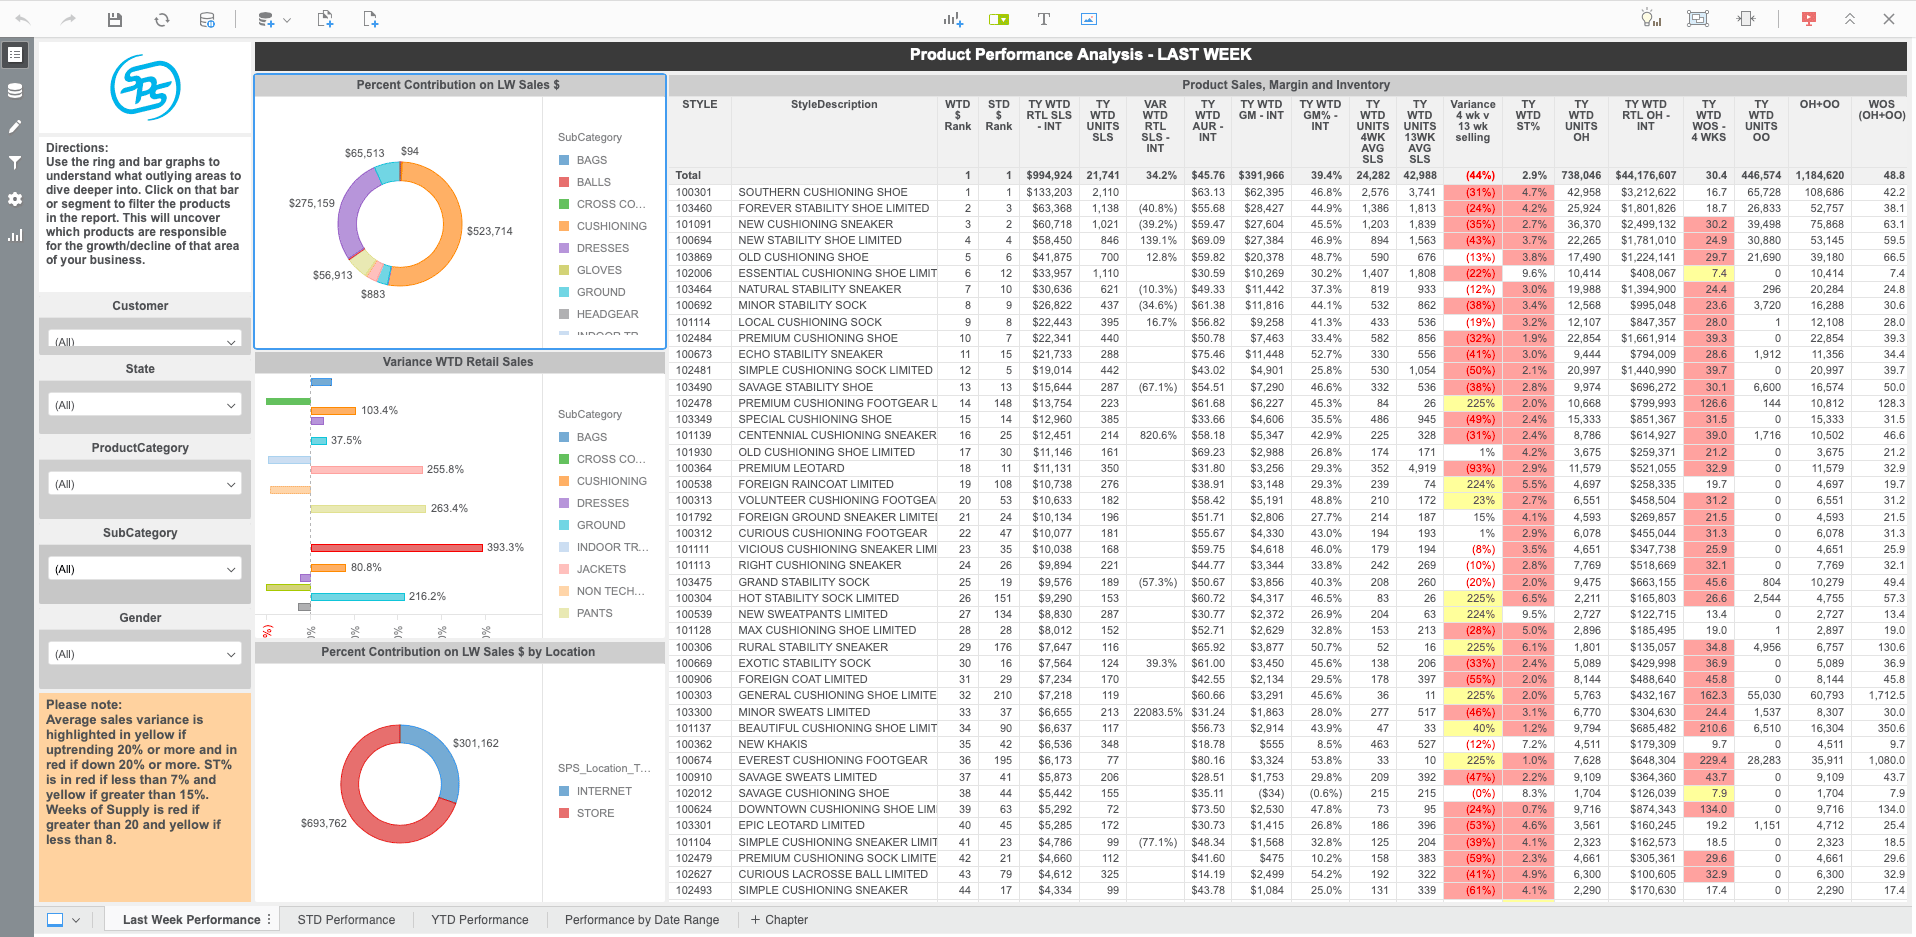
Product performance
Drill down by product to understand the rate of sales growth (or decline) for each product and region. You can also compare your assortment side-by-side across your retailers to identify future opportunities.
Assortment productivity
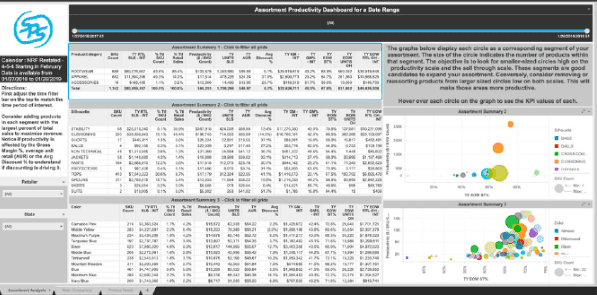
Understand the performance of your assortment by retailer and sales channel to optimize your product mix. Make data-driven decisions to expand your assortment strategically.
Revolutionize your operations with actionable KPIs
Empower your business with the data and insights you need to accelerate growth. To learn more, download our Retail Data Analytics playbook and watch our video:
Over time, customers who use SPS Analytics outperform industry benchmarks.
%
Two-year revenue growth
%
Sell-through volume
%


